8 Most Important Battles of the Greco-Persian Wars
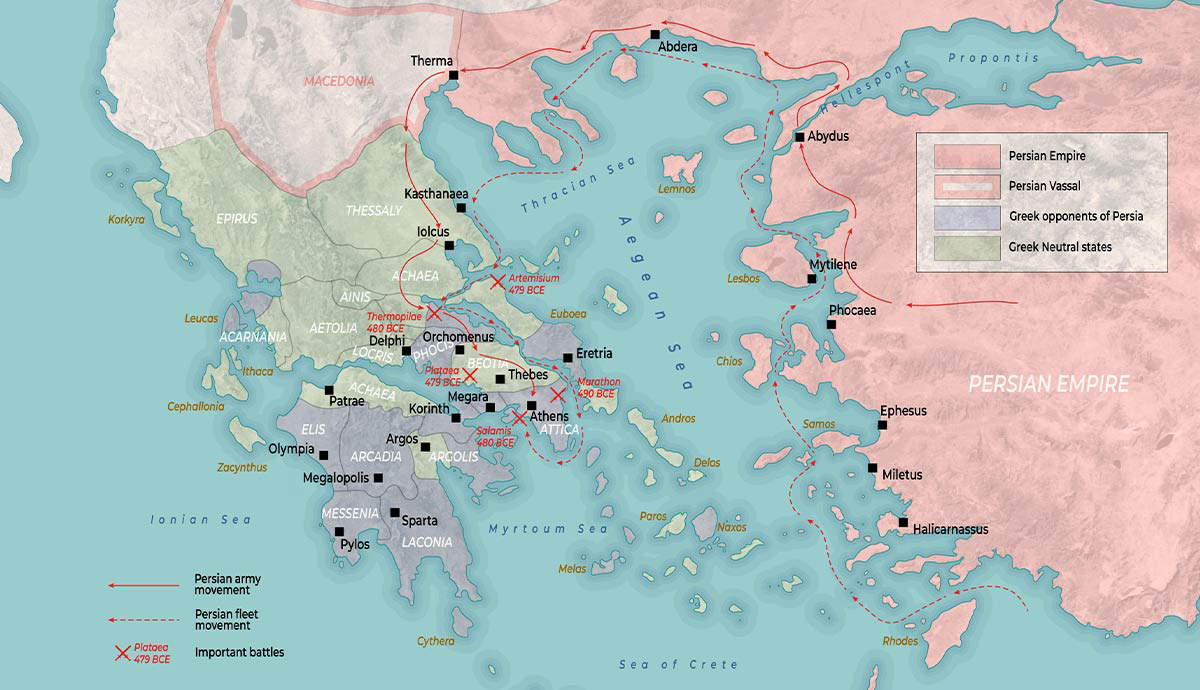
The Greco-Persian Wars consisted of a half-century of conflict between the Persian Empire and a coalition of Greek city-states led by Athens and Sparta. The conflict is best known through the lens of the Greek historian Herodotus, who charted the rise of Persia and its two invasions of Greece in 490 BC and 480 BC. Thanks to Herodotus, the battles of Marathon, Thermopylae, and Salamis are widely known. However, there were several other important battles that shaped the course of the war.1. Siege of SardisThe Temple of Artemis in Sardis. Photograph by Carole Raddato. Source: Wikimedia CommonsThe Greco-Persian Wars began with the Ionian Revolt in 499 BC, when Aristagoras of Miletus in western Turkey rebelled against his Persian overlords. As his rebellion spread throughout Ionia, Aristagoras appealed to the city-states in mainland Greece for military support.Athens responded by sending a fleet of 20 triremes to support Aristagoras, while Eretria on the island of Euboea contributed another five ships. In 498, the Athenians and Eretrians joined the Ionians and marched inland towards the city of Sardis. Almost half a century earlier, the Persians under Cyrus the Great had captured Sardis from the wealthy King Croesus, and the city retained its importance as the capital of the Persian satrapy of Lydia.The Greeks besieged Sardis and occupied the lower town. While the Persians remained in control of the acropolis, much of the lower town was destroyed by fire. The Persians counterattacked and forced the Greeks to retreat to Ephesus. The Athenians withdrew from the alliance, but the revolt continued to spread through Ionia. The Persians gradually mobilized their forces to defeat the Ionian rebels, and the capture of Miletus in 494 effectively ended the Ionian Revolt.According to Herodotus, King Darius of Persia was incensed by the sack of Sardis and vowed to seek revenge on the Athenians. In 507 BC, the Athenians had sought Persian protection to counter the threat of Spartan invasion. While the Athenians regarded the agreement as an alliance of equals, Darius understood it as a gesture of submission. For the King of Kings, Athens was a rebellious vassal and deserved to be punished.2. Battle of MarathonThe heroes of Marathon by Georges Rochegrosse, 1859. Source: Wikimedia CommonsIn 490 BC, Darius ordered the invasion of European Greece with an armed force led by his nephew Artaphernes and a general named Datis. The Persians faced little resistance as they occupied the Cyclades islands in the Aegean Sea. The Persians then landed on Euboea and sacked the city of Eretria as retribution for their involvement in the sack of Sardis.From Eretria, the Persians crossed the narrow Euripus Strait and landed at Marathon, around 26 miles from Athens. An Athenian army of some 10,000 men marched out to meet the Persians at Marathon. The Athenian battle plan was developed by the general Miltiades, who had previously been a Persian vassal as ruler of the Thracian Chersonese (the Gallipoli peninsula) and understood how to neutralize the superiority of the Persian cavalry.On the morning of September 12, 490 BC, the Athenians advanced towards the Persian camp with a weak center and strengthened flanks. When they were around a mile from the enemy, and with the Persian cavalry still unprepared for battle, Miltiades ordered the Athenian hoplites to rush at the enemy.As the Athenians closed the distance amidst volleys of arrows from the Persian archers, the two armies engaged in a ferocious melee. Although the weak Athenian center was broken, the hoplites proved superior on the flanks and closed in against the fragmented Persian forces. While the Athenians lost 192 men, they killed thousands of Persians as they fled towards their ships.The Athenian victory at the Battle of Marathon demonstrated that the Persians were not invincible. For the Persians, the defeat was an embarrassment, but Darius could still claim victory with the occupation of the Cyclades and the destruction of Eretria.3. Battle of ThermopylaeLeonidas at Thermopylae by Jacques-Louis David, 1814. Source: Louvre Museum, ParisDarius died in 486 BC and was succeeded by his son Xerxes. The new king spent several years suppressing rebellions in Babylon and Egypt before mobilizing a much larger army for his invasion of Greece in 480.Xerxes took personal command of the Persian army and led it across the Hellespont on a pontoon bridge into Europe. As the Persians made their way south in August, the Greeks were preoccupied with the Olympic Games and other religious festivals and were unable to mobilize their full force. Nevertheless, King Leonidas of Sparta decided to fight a delaying action at Thermopylae with his elite bodyguard of 300 men, some 2,000 Spartans of lesser status, and motley collection of allied contingents.With around 7,000 men at his disposal, Leonidas faced a Persian army in the tens of thousands. The narrow pass of Thermopylae between sheer cliffs on one side and the sea on the other negated the Persians numerical advantage. Leonidas and his men took up their positions behind an old defensive wall and successfully repulsed Xerxess assaults for two days.After the second day of battle, a Greek man named Ephialtes showed the Persians a narrow mountain pass which would allow them to outflank Leonidas. In the early hours of the third day, the Persian Immortals overcame the lightly defended pass and threatened Leonidass rear. Having sent away the allied contingents who wanted to fight another day, Leonidas and the remaining Greeks sallied forth and inflicted heavy casualties on the enemy before falling in action one by one.4. Battle of ArtemisiumBust of Themistocles, c. 470 BC. Museo Ostiense, Ostia, ItalyAlthough Leonidas was killed and the Greeks were defeated, the Battle of Thermopylae has been remembered as the greatest ever demonstration of Spartan military prowess. However, Leonidass heroic stand at Thermopylae cannot be understood without reference to the simultaneous naval action off Cape Artemisium.Before Ephialtes informed the Persians of the mountain pass, the Persians hoped to outflank Leonidas by sending a detachment of men by sea and landing in his rear. A Greek fleet under the command of the Spartan Eurybiades and the Athenian Themistocles lay in wait off Cape Artemisium at the northern end of Euboea and held off the Persian ships.Both sides suffered heavy losses at Artemisium, and after the Greeks were defeated on land at Thermopylae, Cape Artemisium lost its strategic importance and the Greek fleet withdrew towards Salamis.5. Battle of SalamisMap of the Battle of Salamis. Source: TheCollectorAfter overcoming the Greeks at Thermopylae, the Persian army proceeded towards Athens. The Athenians chose to abandon their city to the Persians and man the Athenian fleet. The Persians duly entered Athens and sacked the city.Meanwhile, the Spartans and their allies in the Peloponnesian League prepared to make a stand against the Persians at the Isthmus of Corinth. As at Thermopylae, the Isthmus was a narrow strip of territory that was easily defensible on land but was vulnerable to a flanking maneuver by sea. From the island of Salamis in the Saronic Gulf, Themistocles fleet of some 400 ships lay in wait for the Persian fleet.The Athenian commander enticed Persian fleet into the straits of Salamis by sending a message to Xerxes claiming that he was prepared to surrender. The Persian fleet struggled to maneuver in the crowded straits and as Xerxes realized that he had been tricked. A chaotic battle ensued during which Xerxes brother, the admiral Ariabignes, was killed. With the Persians in disarray, Queen Artemisia of Caria extricated her ship from the fray by ramming into an allied Persian ship, convincing nearby Greek ships to leave her alone as she made her escape.Following the defeat at Salamis and renewed unrest in Babylon, Xerxes returned to Persia but left a sizeable Persian army under the command of the general Mardonius. The Persians were now on the back foot, but their threat to the allied Greek city-states had not yet been extinguished.6. Battle of PlataeaIllustration of Greeks and Persians at the Battle of Plataea by John Steeple Davis, 1900. Source: Wikimedia CommonsAfter wintering in northern Greece, Mardonius marched south in early 479 with an offer of peace to the Athenians. The Athenians, who understood that the Persians were seeking to undermine the Greek alliance, refused the peace deal in the presence of a Spartan delegation. Mardonius proceeded to sack Athens for a second time, razing any every single structure to the ground.After receiving news of the second sack of Athens, the allied Greek army marched north to confront Mardoniuss army. They were led by Pausanias, who served as regent for his young cousin Pleistarchus, the son of the fallen Leonidas. Pausanias had around 40,000 men at his disposal, including 10,000 Spartan and 8,000 Athenian hoplites.Mardonius fell back towards Plataea and took up his position on the north bank of the Asopus River, where the open plain allowed the Persian cavalry to freely maneuver. The Greeks approached the Persian position in mid-August and both armies were stalemated. After ten days or so, the Persian cavalry cut the Greek supply of water, forcing the latter to retreat in some disorder towards Plataea.On August 27 or 28, the Persians crossed the Asopus in pursuit of the Greeks. The Spartans were under heavy pressure but counterattacked, demonstrating the superiority of their hoplites against the lightly armed Persian infantry. While the Spartans lost several senior commanders, the Persian general Mardonius was also slain in battle. The leaderless Persians routed, and the Greek victory at the Battle of Plataea the end of the second Persian invasion of Greece.7. Battle of MycaleThe Greeks storm the Persian camp at Mycale. Source: History ForceAccording to Herodotus, the Greek victory on land at Plataea took place on the same day as an equally important naval victory at Mycale, several hundred miles away on the Ionian coast.After the Battle of Salamis, the surviving Persian ships limped to the island of Samos off the Ionian coast. Meanwhile, the Greek fleet assembled at the island of Delos in the Cyclades. The fleet was under the overall command of Spartan king Leotychides. The Athenian contingent was led by Xanthippus, the father of the famous statesman Pericles.When the Greek navy reached Samos in August 479 BC, they discovered that the Persians had withdrawn to the mainland at the foot of Mount Mycale. Leotychides proceeded to Mycale while the Greek soldiers disembarked and prepared to engage the Persians. The Greek commanders appealed for assistance among the Ionian Greeks in the Persian army, prompting the Persians to detach the Ionians from the main army and weaken their force.Although the Persians were deployed behind a palisade wall, the Athenians launched a ferocious attack and broke the Persian lines while the Spartans attempted to outflank the Persians on the left. By the time the Spartans completed their maneuver, the battle was good as won, and the Spartans provided the coup de grace.While both sides suffered heavy losses, the Battle of Mycale destroyed any prospect of the Persians returning to Greece in the near-term. As the Ionian cities made a second attempt to liberate themselves from Persian rule, the Greek fleet captured Sestos on the Gallipoli peninsula. The following year, Pausanias captured Byzantium on the Bosphorus, thus securing both land routes into Greece.8. Battle of the EurymedonBust of Cimon at the beach of Lanarca, Cyprus. Photograph by Markus Leupold-Lwenthal. Source: Wikimedia CommonsWhile Herodotuss Histories ended with the Battle of Mycale, the conflict between the Greeks and Persians continued for almost three decades. The second phase of the Greco-Persian Wars is known as the Wars of the Delian League, since the Athenian-led Delian League continued the counterattack against the Persian Empire after the Spartans withdrew from the war in 478.While the period between the end of Herodotuss Histories (479 BC) and the start of Thucydides History of the Peloponnesian War (431 BC) is poorly documented, the most prominent Athenian general during the Wars of the Delian League was Cimon, the son of Miltiades and the rival of the young Pericles. Often satirized in the plays of Aristophanes, Cimon was nevertheless an accomplished soldier who achieved great military success.Cimons greatest victory came at the Battle of Eurymedon near Aspendos in southern Turkey, fought in either 469 or 466 BC. Upon receiving news that the Persians were assembling a fleet in Aspendos, Cimon led 200 triremes in a pre-emptive attack. After the Greek ships overcame the Persian fleet on the River Eurymedon, Cimons hoplites routed the relieving Persian army on land. The destruction of the Persian fleet at Eurymedon held back Persias efforts to reassert itself in the Aegean.Later in the 460s, the Athenians also attempted to undermine the Persians by supporting an Egyptian revolt against Persian rule, but the Greek expeditionary force was eventually destroyed. Cimon then turned his attention to Cyprus but died during the siege of Kition in 450. The Athenians successfully defended themselves at the Battle of Salamis-in-Cyprus and escaped back to Greece, bringing an end to the Greco-Persian Wars.