Breaking to Build: Fuzzing the Kotlin Compiler
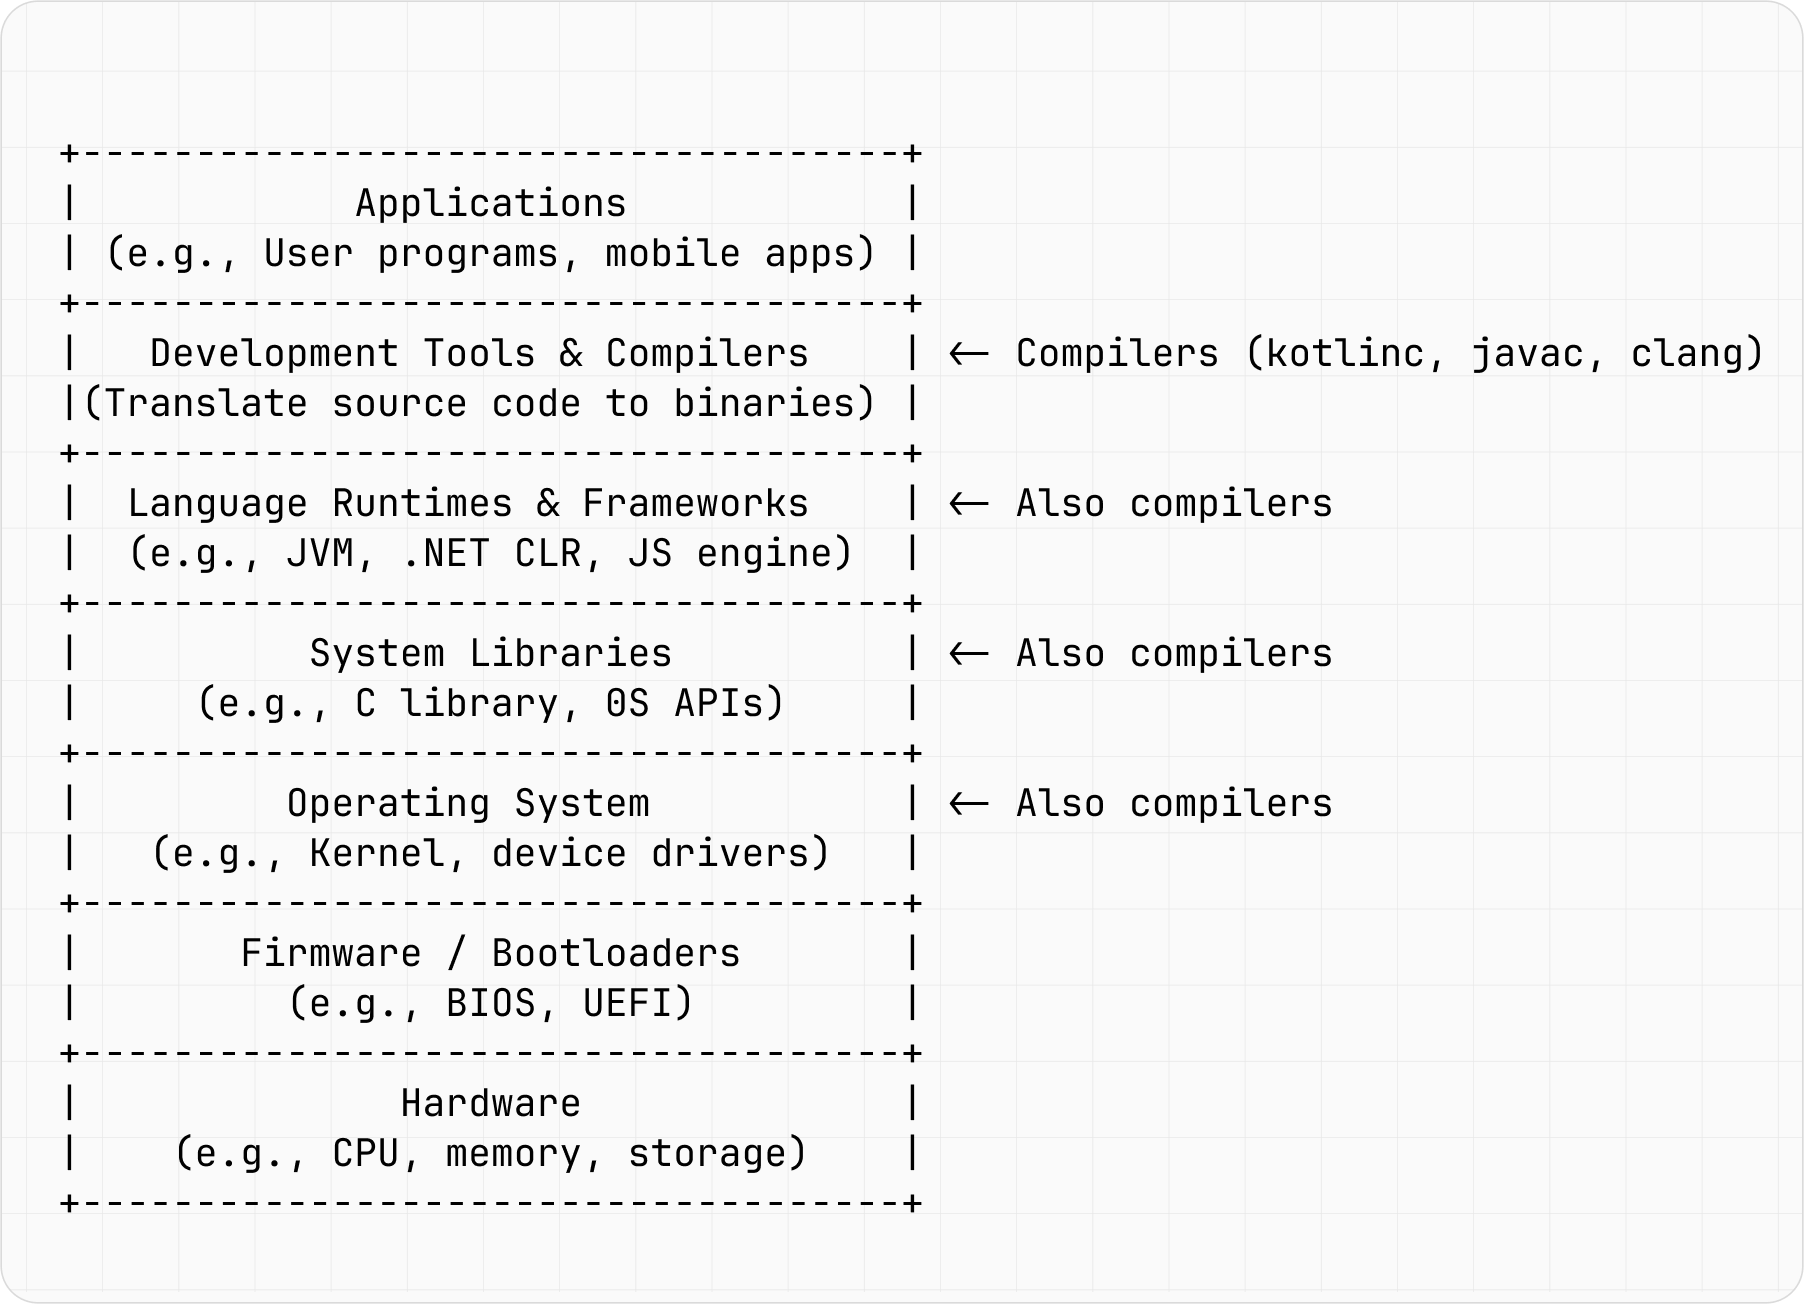
At JetBrains, we care about Kotlin compiler quality. One powerful way to test it? Fuzzing, an approach that feeds programs unexpected, often random, inputs to uncover bugs that traditional tests may miss. It may sound chaotic, but it works, especially for complex software like compilers.In a previous post, our colleagues introduced kotlinx.fuzz, a powerful tool for uncovering bugs in Kotlin programs. As the Kotlin compiler is a Kotlin program, we can use fuzzing to test it, too. In this post we will:Explain what fuzzing is and how it compares to traditional compiler testing techniques.Show how we applied it to the Kotlin compiler in collaboration with TU Delft.Share real bugs we caught and fixed, including in the new K2 compiler.Compiler fuzzing vs. traditional compiler testing techniquesCompilers are essential to software development, as they transform the code we write into instructions that machines can read and then execute. Compilers are used not once, but multiple times throughout the whole software development stack. Without them you cannot compile your operating system kernel, your system library, or your JavaScript engine. Figure 1 points out where compilers are needed, underlining how crucial they are.Figure 1: The importance of compilers in the software development stack.Figure 1 shows that compilers are not just an isolated development tool but are also needed to compile your source code in other places in the stack. This means that when something as important as a compiler contains bugs, it can cause bigger problems, such as:Security holes or vulnerabilitiesIncorrect code generation, subtly inconsistent with the original source codePerformance issues via mistriggered optimizationCompiler crashesSo how do we ensure that compilers are free of errors? The rest of this section will outline some ways to detect bugs, starting with more traditional techniques and then moving on to fuzzing.Uncovering bugs: Traditional techniquesTraditional testing techniques focus on program behavior, namely, whether it produces correct output with valid input while properly handling any errors with invalid input. Table 1 lists some common methods.WhatHowUnit testsCheck individual components (e.g., lexer, parser, code generator)Functional testsVerify that all compiler components behave as expectedGold verification tests (regression tests)Compile a suite of known programs and compare compilation result to the expected output (i.e., gold standard)Integration testsCheck whether compiler runs correctly with other tools or systems (e.g., build systems, linkers, or runtime environments)Cross-platform testsTest compiler on different operating systems or platforms for consistencyTable 1: Traditional testing techniques.These traditional techniques are essential for compiler development, but they may miss subtle bugs that only appear under specific circumstances. This is where advanced techniques like fuzzing can be more successful.Fuzzing, or the art of breaking things to make them betterAt its heart, fuzzing is based on a very simple idea: lets throw a lot of random inputs at a program to see if it breaks. Long before fuzzing was adopted as a named technique, developers have been known to use a form of it. For example, programmers in the 1950s could test programs with a trash-deck technique: they input punch card decks from the trash or random-number punch cards to see when undesirable behavior might occur.While working on the Apple Macintosh in 1983, Steve Capps developed a tool to test MacWrite and MacPaint applications, which at the time were battling low memory conditions. Called The Monkey, it fed random events to an application and caused the computer (in this case, the Macintosh) to behave as if it were operated by an incredibly fast, somewhat angry monkey, banging away at the mouse and keyboard, generating clicks and drags at random positions with wild abandon. To increase testing quality, Capps limited some random events, like menu commands, to a certain percentage, and later Bill Atkinson defined a system flag to disable commands such as quit, so the test could run as long as possible. Although the tool itself became obsolete when later Macintosh iterations freed up more memory, it is an important part of software testing history.The term fuzzing is credited to Professor Barton Miller, who first experienced interference noise on a dial-up link when remotely logging into a Unix system during a storm in 1988. This noise caused the programs to crash, a surprise considering they were common Unix utilities. So that this effect could be explored more in depth, Miller then assigned his students a project to evaluate the robustness of various Unix utility programs, given an unpredictable input stream. One student group went on to publish a 1990 paper with Miller on their findings.Fuzzing fundamentalsIn contrast to carefully designed test cases like those in Table 1 above, fuzzing uses randomly generated inputs that can be unexpected or even deliberately nonsensical. The more diverse the inputs, the more likely the fuzzing tool (i.e., the fuzzer) will be to find unexpected issues.A fuzzer has three essential components: (i) an input data generator, which generates diverse inputs, (ii) the software under test (sometimes abbreviated as SUT), which processes these inputs, and (iii) a reference model, which produces the correct output from the same inputs. Both the software and the reference model produce outputs from the same inputs, and these outputs are compared to one another. Figure 2 depicts the relationship between the three components, the outputs to be compared, and the fuzzing result.Figure 2: Fuzzing basics.The fuzzing result tells us whether or not the software performed correctly with the automatically generated input, as compared to the reference model with that same input. This process is repeated over and over, represented in the above image by multiple windows. This repetition ensures that the inputs used for testing are sufficiently diverse.The idea is to find inputs which cause the software to fail, either by crashing or producing incorrect results. Its not so much about testing the intended functionality. That is, fuzzing investigates the edge cases of what the software can or cannot handle.Compiler fuzzing techniquesSo far, weve covered the basic idea of fuzzing and a brief history of it. In this section, we will get more specific, starting with different ways to fuzz compilers.Two fuzzing types that are more advanced are generative fuzzing, which constructs test programs from scratch based on grammar or specification of the target inputs, and mutation-based fuzzing, which starts with existing, valid, programs and modifies them to create new test inputs. Modifications (mutations) can include inserting, deleting, or replacing input parts. Table 2 lists pros and cons for each.Table 2: A comparison of generative and mutation-based fuzzing.Figure 3 further compares the two techniques to basic fuzzing, underlining their trade-offs on how well they cover different parts of the compiler vs. how deep they can explore it.Figure 3: A comparison of fuzzing types.This section has described fuzzing basics and how fuzzing is an effective method for ensuring a high standard in compiler quality. Going forward, we will focus on fuzzing the Kotlin compiler specifically.Kotlin compiler fuzzingFuzzing is already a widespread practice for many programming languages, from C++ and JS to Java. At JetBrains, our Kotlin team is no stranger to fuzzing the Kotlin compiler. We have collaborated with external research groups to try to break the compiler with differing fuzzing approaches. One of the first collaborations gave us a great example of how to crash kotlinc using 8 characters and the main function. This is shown below.fun main() {(when{}) // Crash in Kotlin 1.3, fixed in 1.5}You can also access the example on Kotlin Playground in Kotlin 1.3 and Kotlin 1.5 versions, i.e., before and after the bug was fixed. The following code blocks contain two more examples of bugs found by fuzzing.fun <break> foo() // Compilation crash on type parameter named `break`fun box(){foo()}This example shows a compiler crash when it encounters a reserved identifier (such as break) in the position of a type parameter.fun box(): String {return if (true) {val a = 1 // No error when we are expected to return a `String`} else {"fail:"}}fun main(args: Array<String>) {println(box())}The above example shows a miscompilation of when the compiler failed to reject an incorrect program: the if expression should return a String, but the true branch does not return anything.Figure 4 displays an incomplete trophy list of found-by-fuzzer bugs, demonstrating fuzzings usefulness. Many of the reported bugs greatly helped us in the K2 compiler stabilization.Figure 4: Incomplete trophy list of found-by-fuzzer bugs.Evolutionary generative fuzzingLast year, we collaborated with TU Delfts SERG team to more rigorously explore the properties of generative fuzzing. In this 2024 paper, we looked at generative fuzzing as an evolutionary algorithm problem and developed a fuzzing approach: Evolutionary Generative Fuzzing. This subsection will describe our approach in more detail.First, lets break down the term evolutionary generative fuzzing. As discussed above, generative fuzzing is a bottom-up approach to creating program inputs, generating them following a specific set of rules. In the present case, the generation rules are based on the language syntax, or the Kotlin grammar, and its semantics, or the Kotlin specification.The terms evolutionary part comes from evolutionary algorithms, an approach that simulates the real evolutionary process. Evolutionary algorithms and a common subtype, genetic algorithms, are optimization techniques that use natural selection and genetic inheritance principles for solving complex problems in programming.First we will talk about the basic concepts of a genetic algorithm, then we will apply these concepts to fuzzing. Essentially, these types of algorithms are meant to mimic the way living organisms evolve over generations to adapt and survive in their environments. Figure 5 depicts this cycle.Figure 5: Genetic algorithm cycle.As a problem-solving technique, a genetic algorithm starts with a specific problem, and for this problem there are multiple candidate solutions. Each solution represents an individual (sometimes called chromosome), which could be, for example, a specific input for a function. A set of individuals represents a population, just like in the natural world. To begin the algorithm, an initial population must be generated, typically a set of random individuals (i.e., candidate solutions). After the initial population is generated, a fitness function evaluates the suitability of each individual within the population, only retaining those individuals most the most fit to move on to the next generation. Then, the set of fit individuals mutate and recombine to form a new population. This new combination of individuals make up the next generations population.Lets apply this to our Kotlin compiler fuzzing approach, represented in the more specialized version of the evolutionary cycle in Figure 6. The lighter-colored and smaller rectangles attached to the larger ones represent the relevant action needed to reach each stage.Figure 6: Genetic algorithm in the evolutionary generative fuzzing approach.To begin, the individuals are Kotlin code snippets created with generative fuzzing. To create the initial population, we sample multiple code snippets, which are then evaluated by a fitness function. And to simulate reproduction, we split each snippet into code blocks, where each block represents an individuals chromosome. These code-block chromosomes then mutate and recombine to create new code snippets, which are sampled to create the next generations population. An important takeaway of the approach is: The evolutionary generative fuzzer is not purely generative: it is also partially mutation-based.As mentioned above, a fitness function plays an integral part in the evolutionary cycle. In this work we hypothesized that structurally diverse code is more likely to exercise different compiler components than more uniform code; by stressing various compiler components, more bugs will be able to be uncovered. To test this, we investigated a baseline and two different ways to calculate the fitness function, with both being attempts to optimize the sampled codes diversity.As a baseline, our approach used what is called random search (RS), as it samples programs without any fitness function. We also used different measures of diversity realized through the fitness functions to apply two novel types of genetic algorithms (GAs): single-objective and many-objective functions for the single-objective diversity GA (SODGA) and many-objective diversity GA (MODGA), respectively. The details of these two genetic algorithms and the baseline are summarized in Table 3.Table 3: Approaches and their fitness-function details.The generated code was then compiled with both the original K1 compiler and the new K2 compiler released with Kotlin 2.0. This allowed us to focus on K1-to-K2 changes and find situations when the new compiler introduces regressions or unexpected behavior changes.Applying any approach listed in Table 3 results in finding interesting bugs, and the different approaches complement each other in terms of bug-detecting categories: random search (RS in Table 3) is effective for detecting more straightforward differential bugs such as out-of-memory errors and resolution ambiguity, whereas the two genetic algorithms (SODGA and MODGA in Table 3) are successful in detecting nuanced problems such as with conflicting overloads, shown in the code example below.fun main() {fun p(): Char { return 'c' }fun p(): Float { return 13.0f }}The intended behavior of the above code block is that the compiler reports a conflicting overloads error, as the two p functions should cause a resolution conflict. The K1 compiler returns the appropriate error, while the K2 compiles the code without any warning. By applying two types of genetic algorithms, we were able to uncover several independent instances of this bug, and we fixed this error in Kotlin 2.0.Overall, our teams complex approach to Kotlin compiler fuzzing has led to the discovery of previously unknown bugs. In combining both generative and mutation-based fuzzing, we have been able to enhance bug discovery.The future of fuzzingFuzzing has already enabled our team to find and fix many compiler bugs, improving the Kotlin compiler. Our research collaboration with TU Delfts SERG team produced a more advanced approach to fuzzing, combining generative and mutation-based methods, and with this foundation we can fine tune fuzzing even more.Fuzzing is an active field of research with many opportunities for advancement, and fuzzing a complex, industrial language like Kotlin presents unique challenges that require careful attention for the advancement of fuzzing, as well as for the results to be useful. These challenges and their possible solutions are listed in Table 4.ChallengePossible solutionMaintaining code validity, with code that is both syntactically correct and semantically meaningful. Often requires fuzzer implementation to include parts tailored to target language.Custom handwritten generators for more complicated parts of KotlinFinding different types of bugs and thoroughly testing all compiler parts to ensure good compiler code coverage.Coverage-guided fuzzing: one component of the fitness function is X if a code snippet reaches so far unexplored compiler partsAfter finding bugs, localizing faults by determining the exact cause and the code responsible. Fuzzers often produce large amounts of test cases, which require manual analysis. MOGDA, as it naturally prefers generating smaller and easier-to-understand programsA good fuzzer needs to be able to avoid duplicates and instead trigger new, unique bugs, instead of the same bugs repeatedly.For now, this problem is solved manually, but there are different possibilities to do this automaticallyTable 4: Fuzzing challenges and possible solutions.Our Kotlin compiler team continues to address these challenges by improving fuzzing capabilities in an incremental fashion. We want to keep on providing you with reliable software, and that includes reducing distractions so that you can focus on having fun while developing in Kotlin!More fuzzing resourcesCurious to explore the research or try out fuzzing on your own Kotlin code? Check out these resources!Our paper in collaboration with TU Delfts SERG teamA post about input reduction in Kotlin compiler fuzzingThe Fuzzing Book, a textbook available online with lots of detailed information and great examplesFuzz Testing: A Beginners Guide, an article with more about different types of fuzzing and how to try it yourselfA Survey of Compiler Testing, another academic article