

NASA Visualization Beautifully Shows Swirling Migration Of Particles In Earth's Atmosphere
NASA Visualization Beautifully Shows Swirling Migration Of Particles In Earth's Atmosphere
High above the oceans and landmasses, an unseen migration is constantly unfolding. These travelers are aerosols: millions upon millions of microscopic particles so small they can drift for days or even weeks, riding the planet’s invisible superhighways.
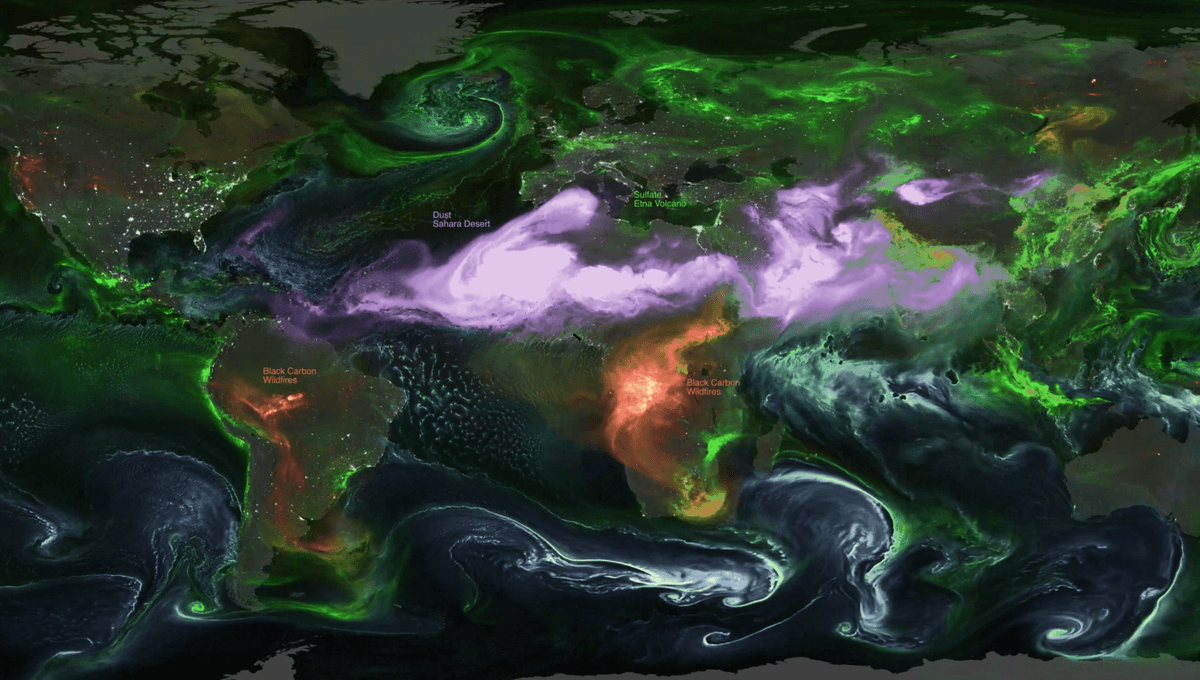
The rest of this article is behind a paywall. Please sign in or subscribe to access the full content. Created by NASA’s Scientific Visualization Studio, the video shows the journey of aerosols swirling through Earth’s atmosphere within a brief window from August 1 to September 14, 2024. It was made using NASA’s Goddard Earth Observing System, a sophisticated model that uses data from satellite observations, on-the-ground measurements, and weather stations to better understand the dynamic movement of the planet's system. Each type of aerosol is painted in its own color: deep blue for sea salt whipped up by storms, magenta for desert dust, fiery orange and red for smoke from wildfires, and bright green for sulfate particles from pollution or volcanic eruptions. By looking at the way different aerosols ebb, flow, and twirl around Earth, it’s possible to gain all kinds of insights into different weather systems and the environment. For instance, that vast plume of pink heading westwards out of Africa is a cloud of desert dust from the Sahara. A significant plume of Saharan sand drifted across the Atlantic during the summer of 2024, impacting air quality across the Caribbean, Florida, and Texas. You can also see a narrow stream of sulfate particles (in green) emitted from volcanic eruptions from Hawaii's Kilauea volcano and Italy's Mount Etna. Worrying amounts of wildfire smoke can be seen gushing out of southern Africa, created by seasonal agricultural burning, as well as South America, generated by the intense wildfires and deforestation. The movement of the aerosols also picks up on the violent swirling of tropical storms. A spiraling cloud of sea salt, sulphates, and dust can be seen in the western Atlantic Ocean, representing Hurricane Ernesto. Meanwhile, Typhoons Shanshan and Ampil can be seen near Japan, drawing in pollution from mainland Asia. Human-made air pollution makes up much of the other green data points on the map. While it tends to emerge from industry and urban centers, it eventually spreads far and away, affecting people beyond the cities. However, just a small amount of the planet's total aerosols are human-made, and the vast majority have natural origins. By mapping these airborne journeys, NASA aims to equip communities and researchers with the insight to anticipate shifts in air quality and visibility, while advancing our understanding of the atmosphere’s ever-changing nature. Beyond its scientific value, the visualization offers a striking reminder that our planet is deeply interconnected.