

"Octopus Maps" Promote Conspiratorial Thinking Even When It Is Unintended
"Octopus Maps" Promote Conspiratorial Thinking Even When It Is Unintended
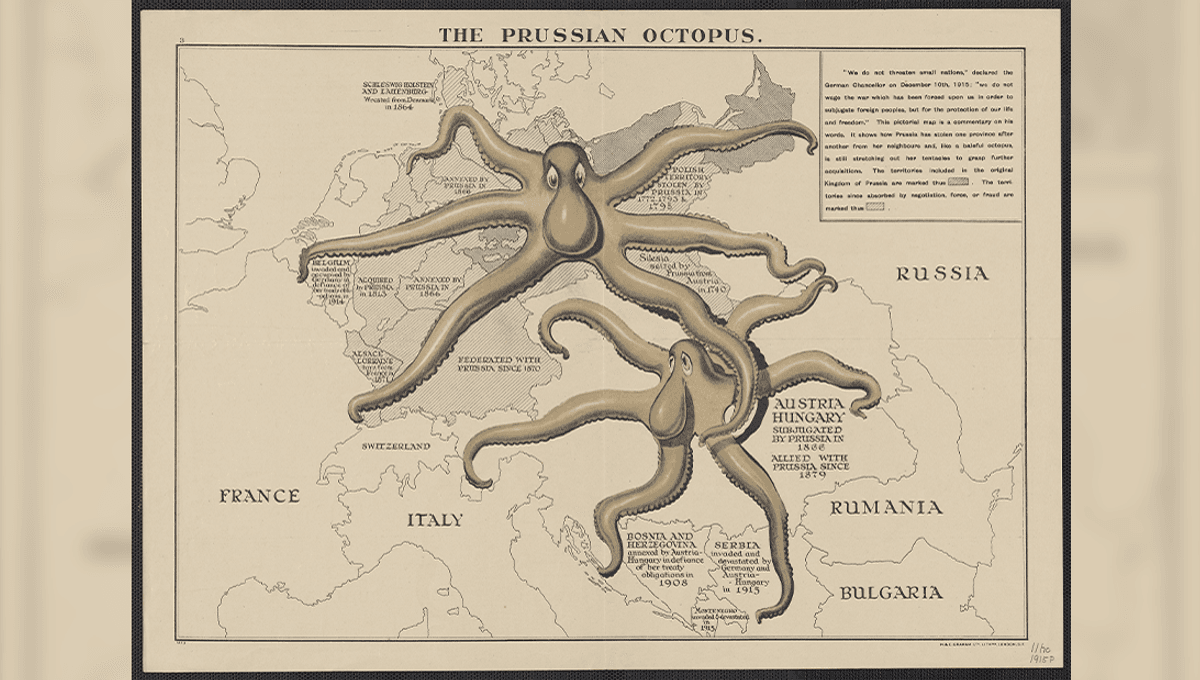
Have you ever heard of an octopus map? If not, you’ll likely see them everywhere after this, as a new study demonstrates. In short, an octopus map is a map that depicts some enemy as a centralized menace with various tentacle-like threats dispersing from them across other territories, or indeed the whole world. Traditionally, these maps have been used to depict political threats, financial systems, or even empires, but it seems they are also popular among conspiracy theorists.
To be clear, this is not a map that is used for anything other than conveying a metaphor of influence, often sinister. In some historical cases, the map literally shows an octopus where a country is – think Nazi Germany before the outbreak of the Second World War – or more abstractly as a sensationalized force that has a centralized point. Either way, the message is clear: this is how far the enemy’s influence reaches. During their new study of this form of depiction, researchers at Northeastern University explored historical examples of octopus maps as well as conducting an empirical study of their visual and structural form, and their overall rhetorical function. They found a rich collection of such maps throughout history, which varied in their form – sometimes as political cartoons, sometimes more “data-driven”, but nevertheless still ideologically specific, cartographic forms. “We find the octopuses of these maps portraying a diverse set of enemies including religious groups, ideologies, wartime adversaries, and abstract concepts. We assert that the octopus map forms a 'visual argument' that communicates a specific view of an adversary as a grasping and acquisitive threat,” the team explain in the paper. They also found that the visual metaphor and design choices for these maps can also encourage people to associate them with threatening views, even without additional efforts by their creators to make them explicitly sinister. This response, the authors argue, makes octopus maps particularly appealing to conspiratorial interpretations of information, as they become an easy way to make it look like “everything is connected” while also depicting the threat as something “nasty” – like a cephalopod, a medusa, kraken, or hydra. Octopuses and any of their tentacular kin are not inherently bad. In fact, they’re incredibly cool, ridiculously clever, overwhelmingly alien, and potentially sentient animals. But historically they have been culturally associated with danger, with grabbing, and gripping, and strange intelligence. This makes them an easy vehicle for conveying negative ideas. The team identified six main traits that octopus maps contain. They include centrality, “tentacularity”, reach, intentionality, “grabby-ness”, and threat. Of course, the first two refer to the depicted threat’s centralized position and the extension of its arms. This represents the controlling range the entity has. The intentionality demonstrates that, while the arms all look independent, they are in fact all part of a deliberate strategy. Conspiracy theories often assign agency to small unrelated groups which they see as intentionally conspiring. The purpose of these arms, these seemingly independent factors, is to acquire or control their targets, which is where their “grabby-ness” comes in. And finally, the ultimate goal of the octopus is, in this context at least, to be evil and dangerous. This map dated to 1877 uses the octopus motif as well as other satirical characters. The team also found that maps don’t need to be overt in their messaging to convey the intended threat. In an experiment, they showed a group of participants a set of maps of “Huskiland”, a fictional country that appeared in an international newspaper. The map showed the country’s military bases in the region. This data was neutral, as it could be interpreted as showing Huskiland as a benevolent leader protecting with a military alliance, or a malevolent force seeking regional control. The participants were then asked to confirm whether and to what extent they agreed or disagreed with a number of statements related to the six traits mentioned above. These included statements like “Huskiland is a central military power in the region”; “Huskiland is expanding its military reach”; “Huskiland uses these bases to exert military or political control over its neighbors.” These questions were deliberately loaded as the data itself did not provide any evidence that Huskiland was a good or bad force. The team found that without prompting, participants identified Huskiland as being in a “tense” or “adversarial” relationship with its neighbors. It seems the more connections there were to a country, the more of a threat participants were able to identify. This, the team argue, demonstrates that the design choices in mapmaking can impact how an audience interprets the information, whether or not there is a very obvious octopus in the center. This suggests that conspiratorial thinking can be more easily prompted then previously supposed. “In the midst of the 'rapid rise' of emotional appeals in data visualization, and the ubiquity of data visualizations among conspiratorial groups, we point to a need to examine the unique persuasive power of charts and maps, which often take advantage of a (falsely) assumed trustworthiness or objectivity of data,” the authors wrote. “Visualizations are not just the dispassionate communication of insights in data, but can also be exploited to fan the flames of fear, hatred, and xenophobia.” The study is published in the Proceedings of the 2025 CHI Conference on Human Factors in Computing Systems .